TOTAL BALLOTS RETURNED
110
110 Total Registered Requests
MAIL-IN ABSENTEE
110
100.0% of Total Returned
IN-PERSON EARLY VOTING
0
0.0% of Total Returned
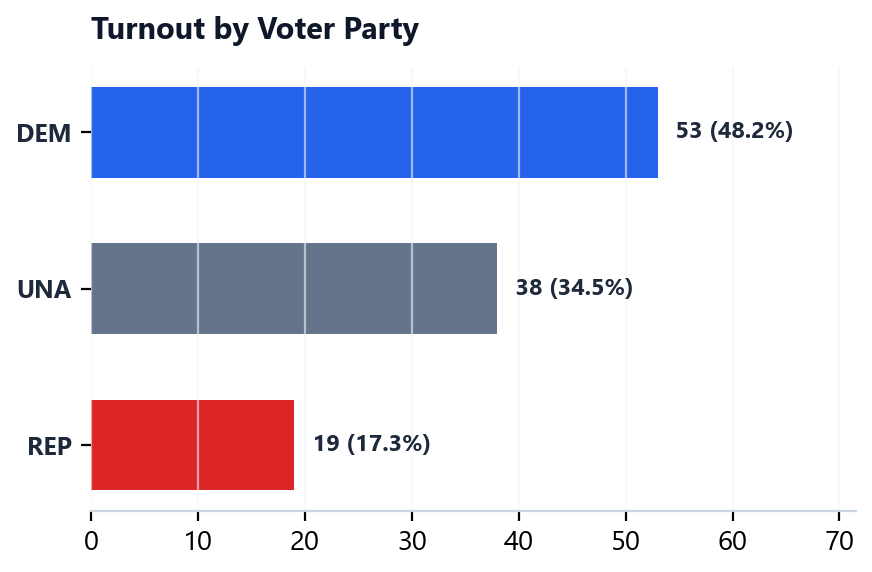
PARTY COMPOSITION
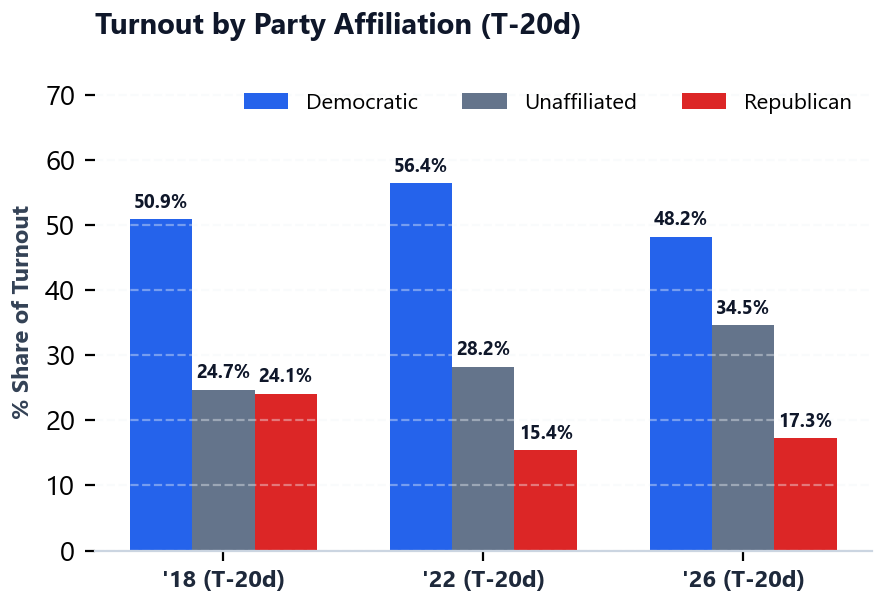
DEM: 48.2%
UNA: 34.5%
REP: 17.3%
2018 MIDTERM (AT T-20d)*
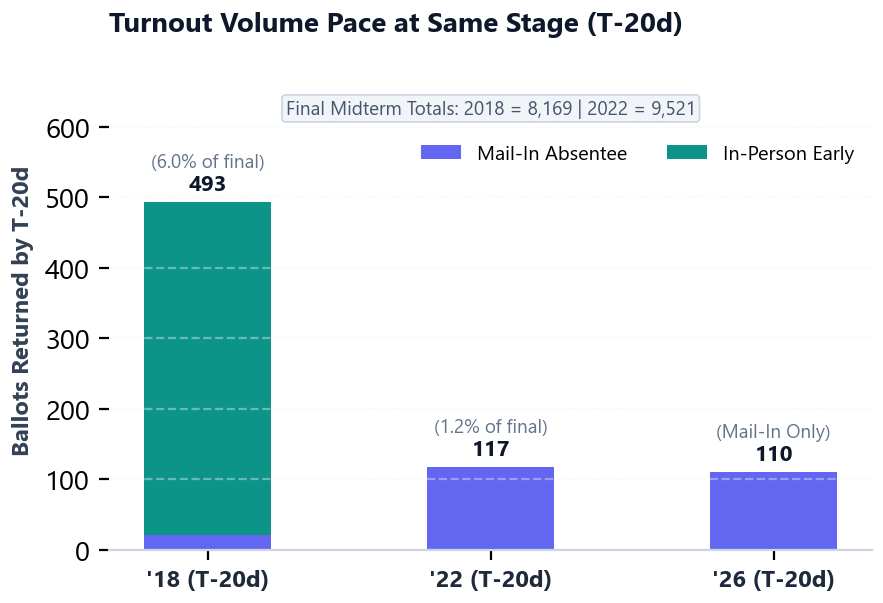
493 Ballots
Final: 8,169 (6.0% cast by this date)
2022 MIDTERM (AT T-20d)
117 Ballots
Final: 9,521 (1.2% cast by this date)
2026 GENERAL (CURRENT T-20d)
110 Ballots
2022 Final Midterm Total: 9,521 Ballots
| METRIC / CATEGORY | 2018 (T-20d)* | 2022 (T-20d) | 2026 (CURRENT) | 2026 VS '22 PACE | 2022 TOTAL |
|---|---|---|---|---|---|
| Total Ballots Returned | 493 (6.0%) | 117 (1.2%) | 110 (In Progress) | -7 (94.0%) | 9,521 Ballots |
| Mail-In Absentee Ballots | 20 (4.1%) | 117 (100.0%) | 110 (100.0%) | 94.0% of '22 | 599 (6.3%) |
| In-Person Early Voting (One-Stop) | 473 (95.9%)* | 0 (0.0%) | 0 (0.0%) | Opens Oct 15 | 8,922 (93.7%) |
| Democratic Turnout Share | 50.9% (251) | 56.4% (66) | 48.2% (53) | -8.2% | 39.1% (3,724) |
| Unaffiliated Turnout Share | 24.7% (122) | 28.2% (33) | 34.5% (38) | +6.3% | 33.2% (3,157) |
| Republican Turnout Share | 24.1% (119) | 15.4% (18) | 17.3% (19) | +1.9% | 27.5% (2,616) |
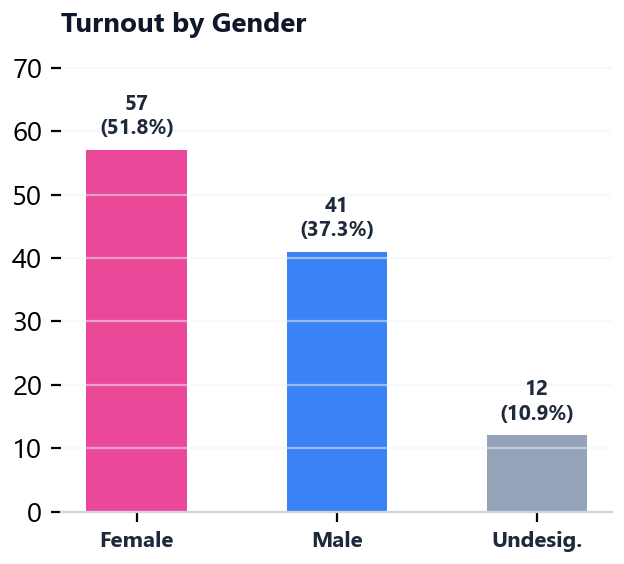
| Female Turnout Share | 51.3% (253) | 56.4% (66) | 51.8% (57) | -4.6% | 53.0% (5,043) |
| Male Turnout Share | 47.3% (233) | 41.0% (48) | 37.3% (41) | -3.7% | 43.1% (4,107) |
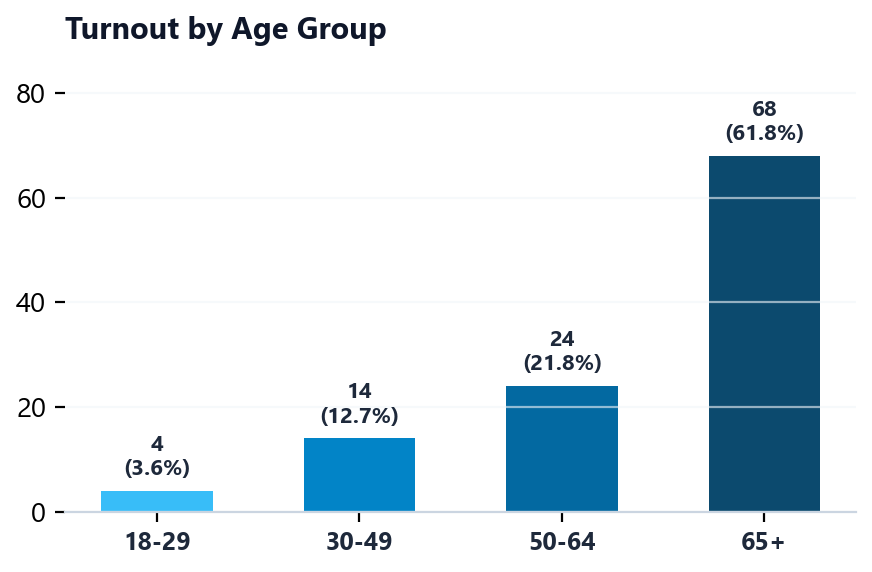
| Senior Voters (Age 65+) Share | 58.6% (289) | 63.2% (74) | 61.8% (68) | +1.3% | 44.3% (4,216) |